Collecting Debug Recording Messages
To collect debug recording packets, use the open source packet capturing program, Wireshark. This allows you to analyze AudioCodes debug recording protocol.
|
●
|
The default debug recording port is 925. You can change the port in Wireshark (Edit menu > Preferences > Protocols > AC DR). |
|
●
|
The source IP address of the messages is always the OAMP IP address of the device. |
|
●
|
By default (no filters applied), debug recording doesn't capture media (i.e., RTP/RTCP) but captures only non-media (e.g., SIP, syslog, and Web).
This is to prevent CPU overload (and even device crashes) when medium or high traffic exists.
Therefore, debug recording is not intended to capture media. However, if you need to capture full media packets (all headers) using debug recording, please contact AudioCodes support.
If you want to capture media, it's recommended to use the Logging Filter table where you can specify media (see Configuring Logging Filter Rules). |
|
➢
|
To view debug recording messages using Wireshark: |
During installation, it's recommended to choose (default) the Npcap packet sniffing library for Windows.
|
2.
|
Only if you are using a Wireshark version that is earlier than 3.4.0 or you want to do PSTN (NetBricks) traces through Wireshark, you need to download AudioCodes proprietary Wireshark plug-in files to analyze AudioCodes debug recording protocol. Otherwise, skip to Step 3. |
|
●
|
The Wireshark plug-in files are deprecated. Therefore, it's recommended to use Wireshark Version 3.4.0 or later (unless you want to do PSTN traces, which requires the acdr.dll plug-in file). |
|
●
|
The plug-in files are per major software release of Wireshark (excluding 3.4.0 and later). For more information, contact the sales representative of your purchased device. |
|
●
|
Make sure that you download the plug-in files that match your computer's Windows operating system (32-bit or 64-bit processor). |
|
b.
|
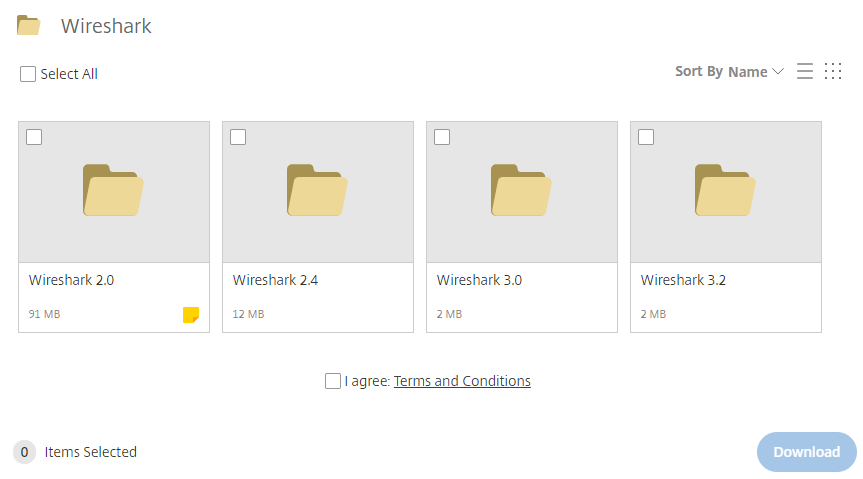
Click the area shown above; folders containing the plug-in files for different Wireshark versions are displayed, as shown in the example below: |
|
c.
|
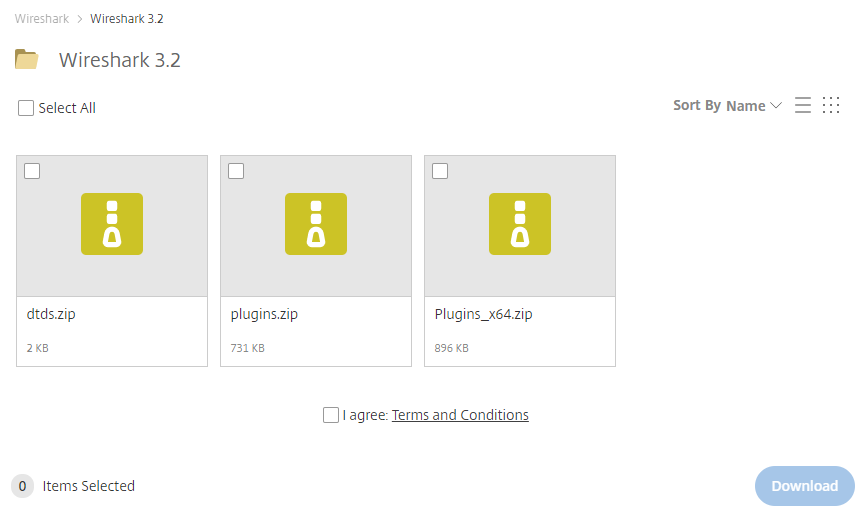
Click the folder icon of the required Wireshark version; zipped folders of the selected Wireshark version are displayed: |
|
d.
|
Select the check box of the required zipped plug-in files, select the I agree (to the terms and conditions) check box, and then click Download; the zipped folder is downloaded to your computer. |
Make sure that you select the zipped plug-in folder that matches your computer's Windows operating system (32-bit or 64-bit processor):
|
●
|
plugins.zip: For 32-bit |
|
●
|
Plugins_x64.zip: for 64-bit |
|
e.
|
Unzip the downloaded plug-in folder; a folder containing all the plug-in files (.dll) is created. |
|
f.
|
Copy all the .dll files to the plugin folder (or for Wireshark Version 3.0 or later, to plugins\<Wireshark version>\epan) of the Wireshark installation. If the folder already has existing .dll files with the same name, overwrite them. |
|
3.
|
Start your Wireshark program. |
|
4.
|
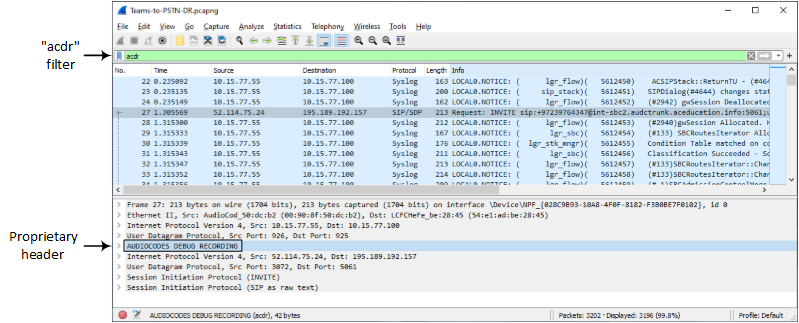
In the filter field, type "acdr" to view the debug recording messages. |
The device adds the header "AUDIOCODES DEBUG RECORDING" to each debug recording message, as shown below: